Geo Intelligence Lab

John S Nkaiwatei

GIS Specialist & Web GIS Developer

I turn spatial data into fast, interactive web maps and clear analysis that people can use to make decisions, on any screen.

Featured project

Transmission Risk Map

A global web map of transmission risk for seven mosquito-borne diseases, from whole countries down to individual districts.

Country → state → district, automatically

Zoom in and the map switches admin level on its own, showing exactly one level at a time so it stays readable and fast.

  • Three zoom levels. Countries when zoomed out, states in the middle, districts up close. Districts load per country only when needed.
  • Parent-region fallback. A district without data takes its state's value; a state without data takes its country's. Inherited values are hatched so they're never mistaken for real ones.
  • Built for phones. Country search, "my location" with the local risk level, and terrain layers, all usable on a 400px screen.
  • React
  • TypeScript
  • Mapbox GL JS
  • geoBoundaries

All risk values in this demo are synthetic, generated for demonstration. They are not real risk estimates.

Open the live map
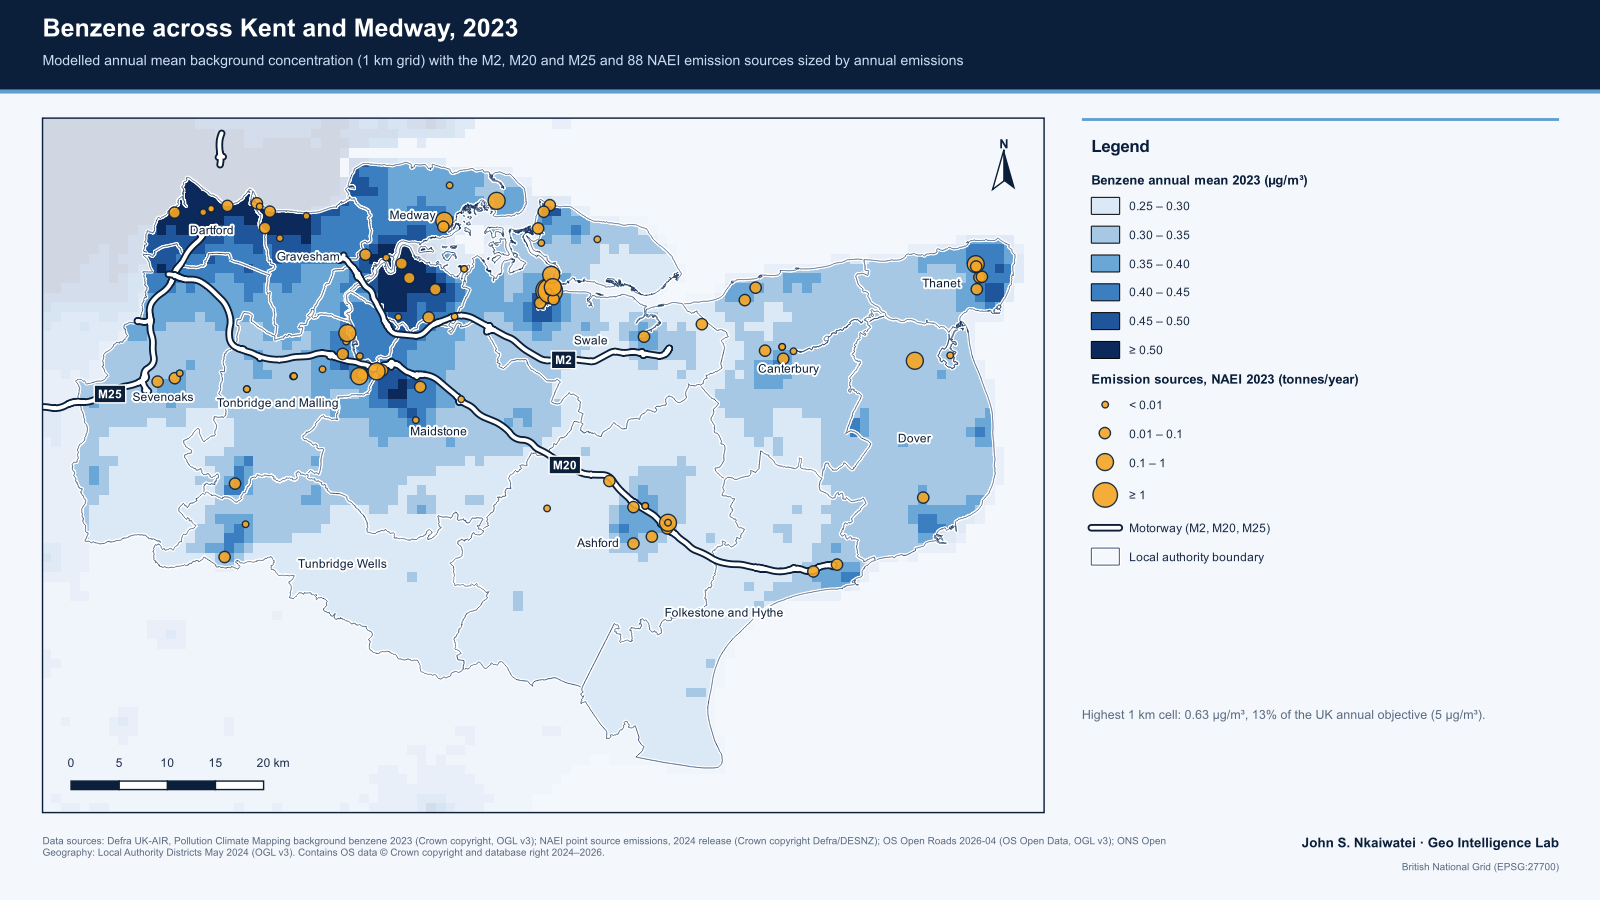
Map of modelled 2023 background benzene across Kent and Medway on a 1 km grid, highest along the Thames side around Dartford, Gravesham and Medway, with 88 emission sources and the M2, M20 and M25 motorways

Case study

Benzene exposure in Kent and Medway, 2023

Which parts of Kent and Medway carry the most background benzene, and how many residents live there? Modelled concentrations, Census 2021 population and emission sources, combined in a rerunnable pipeline.

  • Well below the limit. The highest 1 km cell reaches 0.63 µg/m³, about one-eighth of the UK annual objective of 5 µg/m³.
  • The Thames side carries the burden. 337,566 residents (18.2%) live at or above 0.50 µg/m³, and 92% of them are in Medway, Dartford and Gravesham.
  • Big emitters don't set the pattern. 88 sites released 12.3 tonnes in 2023, yet emission size and local concentration are almost unrelated (Spearman ρ = 0.11).
  • QGIS
  • Python
  • Defra PCM
  • Census 2021
Read the full case study (PDF)
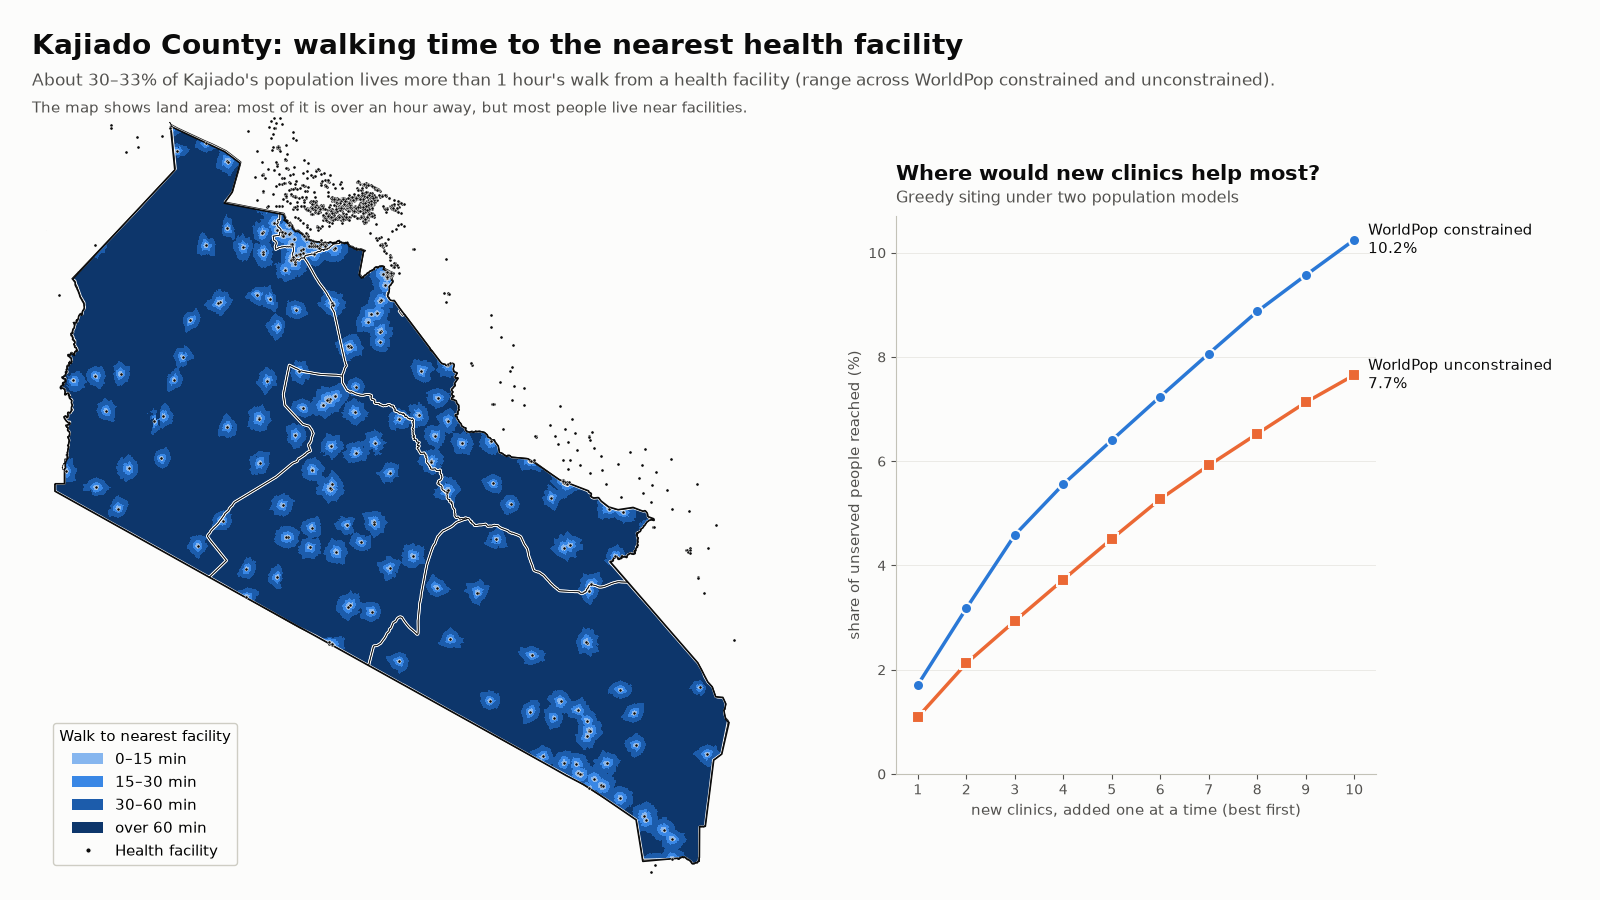
Map of Kajiado County, Kenya, showing walking time to the nearest health facility in four bands, with most of the land more than an hour away, beside a line chart of the share of unserved people reached as one to ten new clinics are added under two population models

Case study

Walking access to health care in Kajiado County, Kenya

Which areas are more than an hour's walk from a health facility, and where would new clinics reach the most people? Slope-aware walking times over roads and terrain, 1,601 facilities, two population models, and a pipeline with stop-and-report quality gates.

  • About 30–33% live beyond an hour's walk. That is roughly 290,000–383,000 people, a range across two WorldPop population models and the census totals.
  • The best single site depends on the model. The two models' top sites are 186 km apart, so the analysis reports sites both agree on: pairs in Kuku ward that each reach about 3,500–4,200 unserved people.
  • Ten clinics close part of the gap. Added one at a time, ten well-placed clinics bring 8–10% of the unserved within an hour.
  • Python
  • WorldPop
  • OpenStreetMap
  • Copernicus DEM
Explore the interactive map Read the report (PDF)

Services

What I can build for you

Clear scope, fixed starting prices. Every project is quoted after a short call about your data and goals.

GIS Analysis & Cartography

FROM$250

  • Suitability, proximity and overlay analysis
  • Print-ready maps for reports and proposals
  • Clear write-up of method and results
Get a quote

Starter Web Map

FROM$350

  • Your data on an interactive, mobile-friendly map
  • Pop-ups, legend and basic styling
  • Shareable link, ready to embed
Get a quote

Based in Nairobi. Local rates available for East African organisations.

Track record

Trusted by clients on Fiverr

37reviews on my GIS gig
74completed Web GIS orders

Read what clients say about working with me, and see the full order history on my Fiverr profile.

See my Fiverr profile

Contact

Let's map your project

Tell me about your data and what you need it to show. I usually reply within a day.